2026-Q2
Complete- Successful scans
- 230
- Average ATS score
- 69/100
- At or above Pika threshold
- 43.5%
We analysed 226,923 successful Pika ATS diagnostic scans, May 2026 to October 2026. 91.2% scored below Pika's 70/100 ATS-ready threshold. Repeat scans may be included, so this is not a count of unique people or documents.
Data updated Oct 31, 2026. Methodology reviewed Sep 12, 2026.
Live score benchmarks
On Pika Resume's current diagnostic rubric, 70/100 or higher is labelled ATS-ready. The current average is 60.7/100 and the median is 62/100 across 226,923 successful Pika ATS diagnostic scans. This is Pika's product threshold, not a universal employer ATS score or hiring prediction.
ATS-ready threshold
Average ATS score
Median ATS score
Top-10% benchmark
On Pika's current scale, 76/100 is 6 points above the 70-point ATS-ready threshold. It also meets the current top-10% benchmark of 68/100. That makes 76 a good diagnostic score on Pika's scale, but it is not a universal score from an employer ATS.
Three findings within Pika's eligible diagnostic-scan sample.
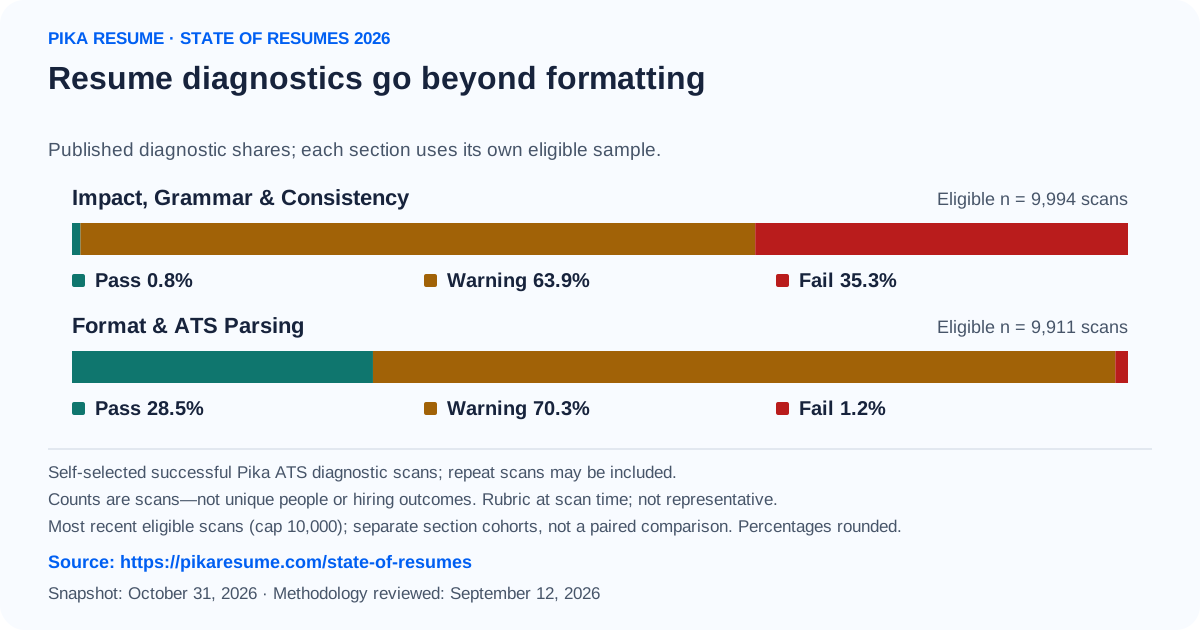
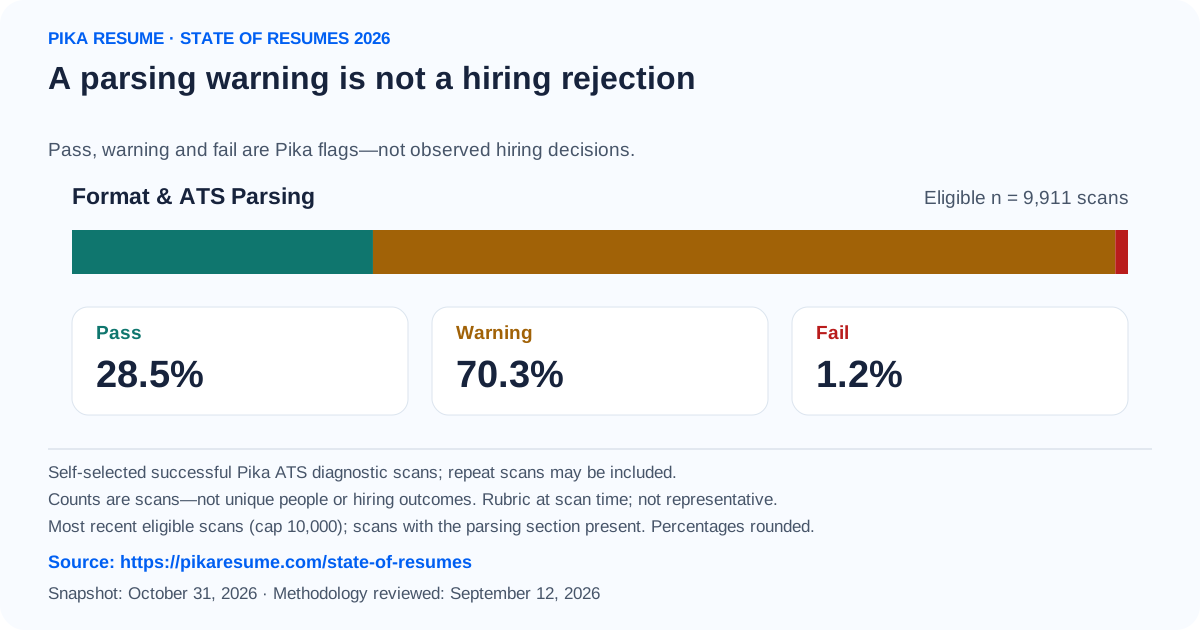
1.2% of 9,911 eligible scans fail formatting and parsing outright; 70.3% receive a warning. Compare all eight Pika checks in the section profile below.
It is the most common outright Pika diagnostic flag among 9,994 eligible successful scans, about 29x more often than formatting.
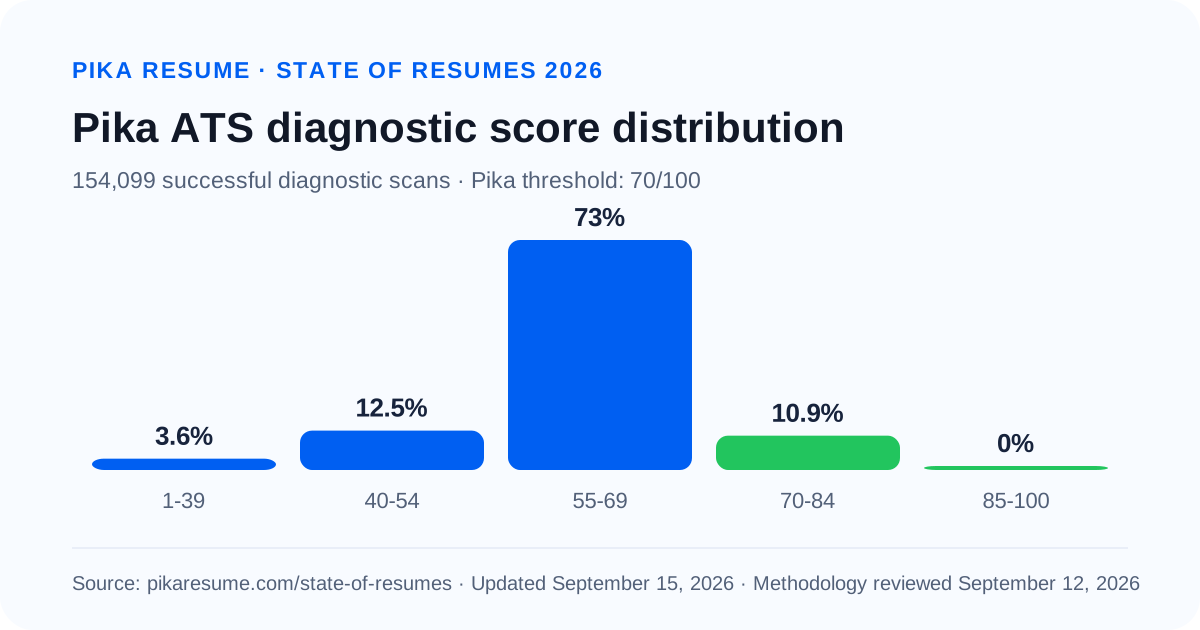
Only 0.1% of scans — 136 successful scans — scored 85 or higher. 91.2% fall below the ATS-ready line. The section breakdown shows where improvement is concentrated.
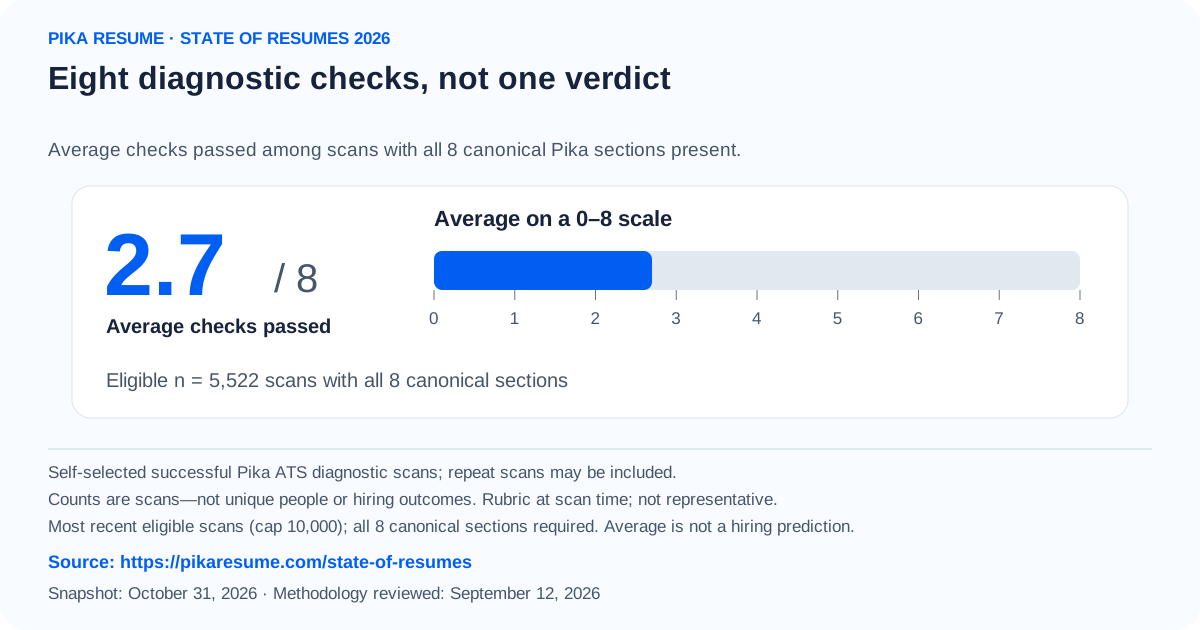
Across the most recent 5,522 eligible successful scans, each scanned resume runs the same 8 Pika checks. The average clears 2.7 without a warning or failure. The clean-sweep rate is 0% (rounded); the exact count of scans passing every check is not published. This profile is capped at 10,000 scans.
In Pika Resume's current profile sample, Impact, Grammar & Consistency is the most common outright Pika diagnostic flag: 35.3% of 9,994 eligible successful scans fail the check and 63.9% receive a warning. These are Pika rubric results, not employer rejection reasons.
Impact, Grammar & Consistency is Pika's most frequent outright flag in this sample. See your score across all eight sections in about 30 seconds, free.
Where successful scans land on Pika's diagnostic scale. Zero-score results are excluded from this study, so the first published band begins at 1.
The 90th-percentile benchmark is 68 on Pika's scale. Here are the cutoffs across 226,923 successful scans; they are not employer rankings.
Original data
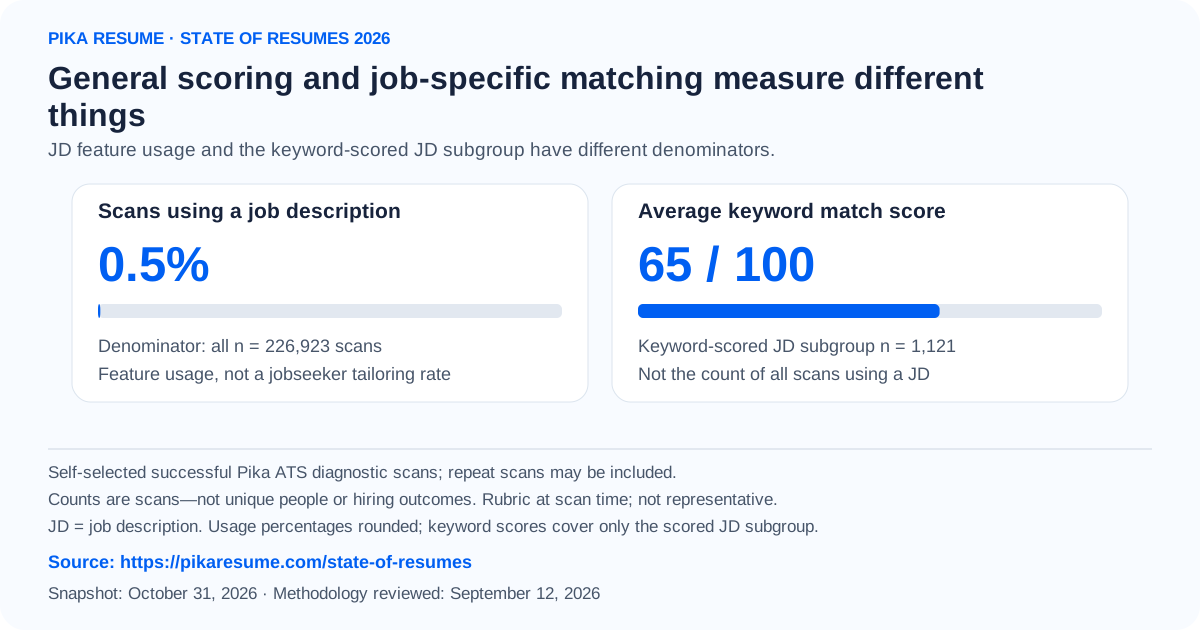
When a resume is checked against a specific job description, the average keyword match is 65/100. Each term below is counted once per resume and divided by the full sample of 1,121 JD-matched scans.
This is a self-selected sample of Pika ATS checks with a supplied job description. It measures terms the submitted job descriptions requested but the scanned resume omitted. A term is counted at most once in each scan; this is not a ranking of skills across the entire labour market.
Successful scans completed each month, with the scan-time average Pika score once the sample is large enough to report. The current month is still filling in. Historical scores are not version-normalised, so this is product telemetry, not evidence of labour-market change.
Successful scan volume, scan-time average Pika score, and the share at or above Pika's threshold. In-progress quarters are labelled “so far”. Historical scores are not version-normalised, so quarters are product telemetry and are not comparable evidence of labour-market change.
Each figure below is a complete, self-contained finding. Quote any of them with attribution and a link to this page.
| Resume section | Pass | Warning | Fail | Avg score |
|---|---|---|---|---|
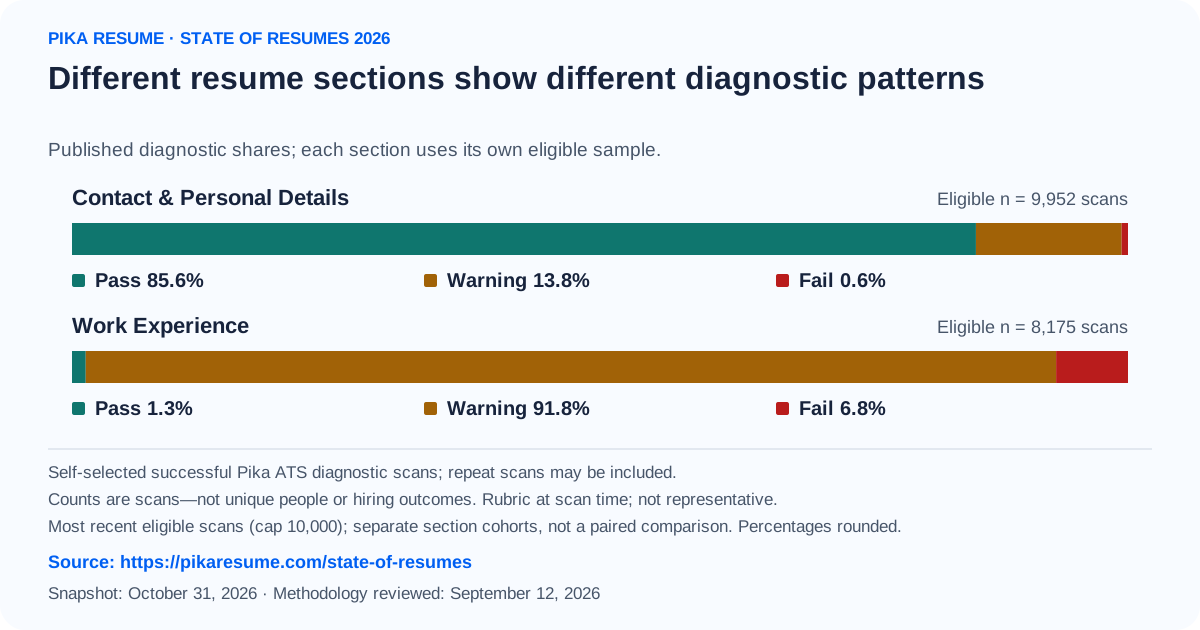
| Impact, Grammar & Consistency | 0.8% | 63.9% | 35.3% | 57.6/100 |
| Projects, Certifications & Achievements | 2.6% | 87.2% | 10.1% | 66.1/100 |
| Work Experience | 1.3% | 91.8% | 6.8% | 61.8/100 |
| Skills & Keywords | 5.5% | 89.4% | 5.1% | 70.5/100 |
| Format & ATS Parsing | 28.5% | 70.3% | 1.2% | 72/100 |
| Section Structure | 64.7% | 34.2% | 1.1% | 78.6/100 |
| Contact & Personal Details | 85.6% | 13.8% | 0.6% | 95.8/100 |
| Education | 67.5% | 32.2% | 0.3% | 80.4/100 |
In Pika Resume's ongoing study of 226,923 successful diagnostic scans, 91.2% score below Pika's 70/100 ATS-ready threshold. That is a Pika product measure, not an employer screening or rejection rate.
Across 226,923 successful Pika ATS diagnostic scans, the average Pika score is 60.7/100 and the median is 62. Pika labels scores of 70 and above ATS-ready under its current rubric; employer systems do not share one universal score.
No. Formatting and parsing fail outright in 1.2% of 9,911 eligible successful scans in Pika's recent profile sample, while 70.3% receive a warning. Other Pika checks produce more outright flags; this study does not observe employer rejection decisions.
Within 226,923 successful Pika ATS diagnostic scans, a score of 68 or higher is at or above the current 90th-percentile benchmark. The top quarter starts at 64, and the scan-level median is 62. These are Pika score percentiles, not employer rankings.
In Pika's most-recent eligible profile sample of 5,522 successful scans, the scanned resume cleanly passes an average of 2.7 of 8 Pika checks. The clean-sweep rate is 0% (rounded); the exact count of scans passing every check is not published.
Among 1,121 successful Pika scans with a job description, Unit Testing is the most frequently missing skill term in the current dataset. It is absent from 253 scans, or 22.6% of the JD-matched sample. This self-selected sample is not the skill mix of the whole labour market.
These figures are computed from 226,923 successful Pika ATS diagnostic scans, May 2026 to October 2026. One successful scan—not one unique person, document, application, or hiring outcome—is the unit of analysis. Repeat scans and document or job-description variants may be counted again.
A successful scan is an eligible completed Pika diagnostic result with a positive 1–100 score that is neither deleted nor watermarked; zero-score and out-of-range results are excluded. A scan at 70 or above is labelled ATS-ready under Pika's rubric, but that threshold is not universal to employer systems.
Headline scores, distributions, and time series use all eligible successful scans. Section-failure and check-profile metrics use the most recent eligible successful scans, capped at 10,000; each published sample size is its denominator. All numbers are aggregate. Rates, averages, and profile cuts below 30 are withheld; time-series scan-volume counts may remain visible below that floor. No resume content, file, or personal information is published. The checks-passed profile further requires all eight canonical Pika checks.
The scans are self-selected and may include repeats, so this dataset is not representative of every applicant, employer, or ATS. Pika's scores are product diagnostics—not employer screening decisions—and do not predict callbacks, interviews, or hiring outcomes. Scores reflect the Pika rubric in use when each scan ran. Until scoring versions are stored with historical results, score trends are product telemetry and must not be treated as comparable evidence of labour-market change.
Missing-skill frequencies use only scans with a supplied job description and keyword score. A term is counted at most once per scan, then divided by all 1,121 eligible JD-matched scans. Quarterly cards mark the current quarter as incomplete; only completed quarters have a closed scan count, but historical score levels remain unversioned telemetry.
Methodology last reviewed Sep 12, 2026. Read the full methodology and limitations.
Research and media kit
Every asset below comes from the same validated aggregate snapshot used on this page. No resume text, uploaded file, or personal information is included. Cite Pika Resume and link to this study when you publish a figure.
Pick an angle for a focused editor brief and source-labelled chart. These are Pika diagnostic observations, not employer rejection rates or hiring outcomes. Downloads refresh independently; compare their snapshot timestamps before combining figures.
For: Careers desks and resume-advice editors
Across 226,923 successful Pika ATS diagnostic scans, the average score was 60.7/100 and the median was 62/100. 91.2% scored below Pika's 70/100 ATS-ready threshold.
Overall score averages, median, and below-threshold rate: all 226,923 eligible successful scans.
The score and ATS-ready threshold belong to Pika's rubric, not a universal employer ATS standard or rejection rate.
Source fields: aggregateData.meta.totalAnalyzed; aggregateData.overall.averageScore; aggregateData.overall.medianScore; aggregateData.overall.failRatePct; aggregateData.meta.passThreshold
Use the tool-specific benchmark to explain scores without claiming employer rejection rates.
For: Workplace, education, and careers reporters
Pika marked 35.3% of 9,994 eligible scans as fail for Impact, Grammar & Consistency, and 1.2% of 9,911 as fail for Format & ATS Parsing.
Impact, Grammar & Consistency rates: 9,994 recent eligible successful scans containing that section. Format & ATS Parsing rates: 9,911 recent eligible successful scans containing that section.
The checks have separate eligible samples, not a paired comparison. Their flags do not identify what causes employer rejection or which edit improves hiring outcomes.
Source fields: aggregateData.sectionFailRates[name="Impact, Grammar & Consistency"].failPct; aggregateData.sectionFailRates[name="Impact, Grammar & Consistency"].warningPct; aggregateData.sectionFailRates[name="Impact, Grammar & Consistency"].sampleSize; aggregateData.sectionFailRates[name="Format & ATS Parsing"].failPct; aggregateData.sectionFailRates[name="Format & ATS Parsing"].warningPct; aggregateData.sectionFailRates[name="Format & ATS Parsing"].sampleSize; aggregateData.meta.profileSampleLimit
Compare the two diagnostic profiles while retaining their separate eligible samples.
For: Consumer technology and fact-checking desks
Among 9,911 eligible scans containing Format & ATS Parsing, Pika recorded 70.3% warnings and 1.2% failures.
Format & ATS Parsing rates: 9,911 recent eligible successful scans containing that section.
Pass, warning, and fail describe Pika diagnostic classifications. A warning or failure is not an observed employer screening decision.
Source fields: aggregateData.sectionFailRates[name="Format & ATS Parsing"].passPct; aggregateData.sectionFailRates[name="Format & ATS Parsing"].warningPct; aggregateData.sectionFailRates[name="Format & ATS Parsing"].failPct; aggregateData.sectionFailRates[name="Format & ATS Parsing"].sampleSize; aggregateData.meta.profileSampleLimit
Explain the difference between product warnings and observed hiring outcomes.
For: Career educators and data journalists
Among 5,522 recent eligible successful scans containing all 8 canonical Pika checks, the average cleanly passed 2.7 checks.
Average clean passes: 5,522 recent eligible successful scans containing all 8 canonical checks, not all 226,923 scans.
Only scans containing all eight canonical Pika checks enter this profile. Rounded clean-sweep percentages do not establish that literally nobody passed every check.
Source fields: aggregateData.checksProfile.avgPassed; aggregateData.checksProfile.totalChecks; aggregateData.checksProfile.sampleSize; aggregateData.meta.profileSampleLimit; aggregateData.meta.checksProfileEligibility
Show how multiple checks complement the headline score without inferring employability.
For: Resume-writing and early-career editors
Pika marked 85.6% of 9,952 eligible scans as a clean pass for Contact & Personal Details, and 1.3% of 8,175 for Work Experience.
Contact & Personal Details rates: 9,952 recent eligible successful scans containing that section. Work Experience rates: 8,175 recent eligible successful scans containing that section.
Each section has its own eligible sample; this is not a paired comparison. Section flags cannot establish skills, employability, or the reason for a warning.
Source fields: aggregateData.sectionFailRates[name="Contact & Personal Details"].passPct; aggregateData.sectionFailRates[name="Contact & Personal Details"].sampleSize; aggregateData.sectionFailRates[name="Work Experience"].passPct; aggregateData.sectionFailRates[name="Work Experience"].sampleSize; aggregateData.meta.profileSampleLimit
Discuss section-specific flags without treating different cohorts as a paired comparison.
For: Job-search, HR technology, and careers desks
0.5% of all 226,923 successful scans included a supplied job description. Separately, 1,121 successful JD scans had a keyword score; their average Pika keyword-match score was 65/100.
Supplied-JD usage (0.5%): all 226,923 eligible successful scans. The exact supplied-JD numerator is not published. Average keyword-match score (65/100): the 1,121 successful scans with a supplied JD and keyword score.
Supplied-JD usage describes successful Pika scans, not how often all jobseekers tailor applications. The keyword-score sample is a scored subset, not necessarily every scan with a supplied JD; the exact supplied-JD count is not published. Keyword matching does not measure callbacks or hiring outcomes.
Source fields: aggregateData.keywordGap.sampleSize; aggregateData.keywordGap.scansWithJdPct; aggregateData.meta.totalAnalyzed; aggregateData.keywordGap.avgKeywordMatchScore
Explain this feature-usage subgroup, not how often all jobseekers tailor their resumes.
Recommended citation
Pika Resume. “Resume Statistics & ATS Score Benchmarks 2026: The State of Resumes.” Updated Oct 31, 2026. Aggregate dataset of 226,923 successful Pika ATS diagnostic scans, May 2026–October 2026. https://pikaresume.com/state-of-resumes
First published 10 June 2026. Methodology reviewed Sep 12, 2026. Self-selected successful Pika ATS diagnostic scans; repeat scans and variants may be included, so counts are not unique people, documents, or applications. The data is not representative of every applicant, employer, or ATS. For a specific aggregate cut, contact support@pikaresume.com. Read the full research methodology.
Related Pika research
The Resume Builder Transparency Index records dated, first-party evidence for 11 resume builders across eight practical product and disclosure criteria. Pika Resume publishes the index and is included in it, with no overall score, rank, winner label, or evidence exception.
Explore the transparency indexRun your resume through the same free ATS checker behind this data. Instant score across all eight sections, after you sign in to save the result.
Run the free ATS resume checker